Using Stereotypes to Teach IELTS part 1 Writing Graph Overviews
Doug LovettUsing Stereotypes to Teach IELTS part 1 Writing Graph Overviews (by Doug Lovett)
One of the difficulties Level 4 students have on the IELTS Task 1 writing is forming the overview of the graph. The IELTS public band descriptors mention “presents an overview” under band 6, and a general statement about a graph also helps students to organize their writing in a more coherent form. I believe if students can understand the overview, their writing will take form beyond what appears by us markers (especially after marking 50+ scripts!) as a bunch of randomly selected numbers from the graph strung together.
However, every semester, many students have difficulties writing the ‘overview’. Every semester I try something different – example after example, modeling the overview, eliciting, guiding, writing together, and every semester I almost think they have it! Then I might show them a graph like this (just something I made up) to check:
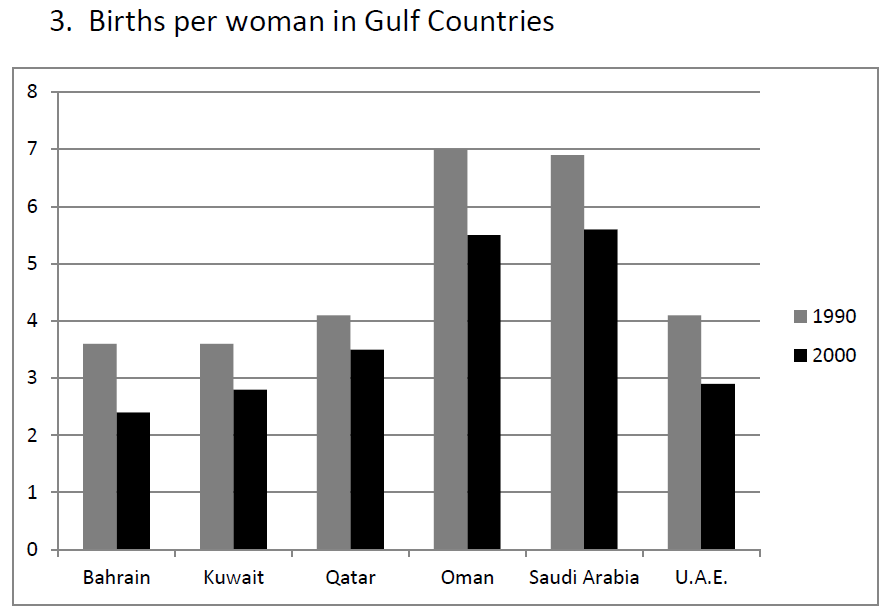
Births per woman in Gulf countries
“So what can we say in one, general sentence about the information here?”
“Ah!” say the students… “Omani women have the most babies!”
Other students nod in agreement. Teacher shakes his head. It may be true on the graph, but it’s not a generalization – it’s a detail.
“Oh!” one student at the back thinks she has it… “Women in Bahrain have the fewest babies!”
So we’re back to square one. Why can teachers see that the graph above shows women in all the gulf countries are having fewer and fewer babies, yet students immediately focus on the highest point, the biggest bar, the most, the least?
So then I realized: I made that graph – of course the overview is clear for me. I started with a general statement in my head, and then I made up graph information to match it. Why would I do it one way, and make students do it the opposite?
Now before I continue, a few words about stereotyping. In the past, this was thought to be a problem that needs to be removed (Schneider 2004:19). Some authors suggested ways to eliminate stereotypes (Wright 2004). But realistically, stereotyping is inevitable. As a form of categorizing, it is a fundamental technique to deal with the vast amounts of information that enter our senses every second (Ottati and Lee, 1995). If we did not have this ability, we would have no idea if the person who walks into the classroom is a friend, enemy, or mode of transportation (Nelson, 1998). Stereotyping is a natural, hardwired process that we cannot function effectively without. Surely there are dangers when we take things too far, but the modern view is that stereotypes are not necessarily good or bad, and can in fact be both (McCauley et al 1995).
So this semester I tried again with the overviews, but with a change. If we’re hardwired to stereotype, let’s start from there, because an IELTS graph overview is really just that. I started with my own general statements about students, and we drew the graphs together (noting all the time that it is not necessarily true in every case, and they may even disagree completely):
Students who miss a lot of classes get lower grades
After a few more examples, students started on their own sentences. I asked them to compare men and women. Students have a lot to say about men and women. Once they had the “stereotype”, the graph was easy. We carried on, making generalizations about people with many children and people with few children. Clear, general overviews with graphs to match. Every sentence they wrote, I pointed out that they did not need any specific numbers or dates, and each “stereotype” we discussed, to show that of course it may not always be the case, and it may not even be everybody’s opinion.
Finally, I started showing graphs first again (after all, students need to be able to think both ways):
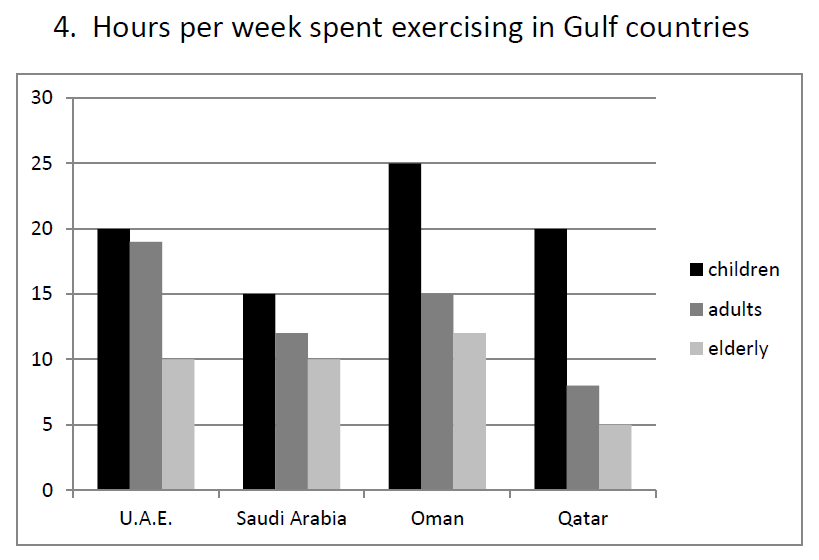
Hours per week spent exercising in Gulf countries
A number of students shout out: “Children get more exercise than adults and elderly people!”
And graph after graph, creating the overview seemed almost too easy.
Okay, I admit, a few weeks later they had fallen back into the “biggest, highest, most, least” trap, but all I needed to do to remind them was ask them:
“Remember when we talked in class about men and women drivers, and you said men were better drivers than women? Remember how we made these general sentences and then drew the graphs?”
And immediately, they know what type of sentence they should write.
References:
McCauley, Clark R., Lee J. Jussim, and Yueh-Ting Lee (1995) ‘Stereotype Accuracy: Toward Appreciating Group Differences’ in Lee et al., 293-312.
Nelson, Gayle L. (1998) ‘Comments on Ruth Spack’s “The Rhetorical Construction of Multilingual Students”’ TESOL Quarterly 32:4, 727-732.
Ottati, Victor, and Yueh-Ting Lee (1995) ‘Accuracy: A Neglected Component of Stereotype Research’ in Lee et al., 29-59.
Schneider, David (2004) The Psychology of Stereotyping. New York: The Guilford Press.
Wright, Shirley A. (2004) ‘Perceptions and Stereotypes of ESL Students’ The Internet TESOL Journal 10:2 (online). Retrieved on February 1, 2008 from: http://iteslj.org/Aticles/Wright-Stereotyping.html.